Best way to understanding of the differences between individual Power BI tools is to realize that every tool has some role in the whole processing of the final report.
In standard MS Business intelligence we have tools by which we ensure data transformations (SSIS), processing of data model with data storage in relation structure (SQL Server) and tool for report producing (SSRS, SSAS). That is exactly the role of Power Query, Power Pivot and Power BI.
All these tools belong to the group of Self-service tools designed for common users.
Power Query – Tool of The Future For Self-Service Business Intelligence in Excel
Power Query is an excel add-on. It ensures ETL processes (Extract, Transform, Load). It also enables user to extract data from various sources (more in article on Power Query).
You can load the data into Excel application and then easily clean the data and transform them into a form suitable for reporting or loading into data model.
The biggest upsides of Power Query:
- It is free (also Power Pivot and Power BI)
- It is used as an add-on of MS Excel (also for Power Pivot and Power BI)
- Enables automatic connection to various data sources and it is possible to update data regularly
- It is possible to easily transform the data after connecting. Power query remembers all the changes and if the data source is changed it automatically repeats all the required steps by refresh.
Powerpivot – Create Data Model in Excel Just Like a Database Professional
Power Pivot is available as an Excel add-on. It is used mainly to create data model in Excel. Its biggest strength lies in combination with Power Query but you can use it even without it.
It is very similar to SSAS (SQL Server Analysis Services) and it makes it possible to save data in compressed form. Extremely fast aggregation with calculation is also made possible. You can use DAX language for queries in Powerpivot in a same way as you can use special language MDX in SSAS.
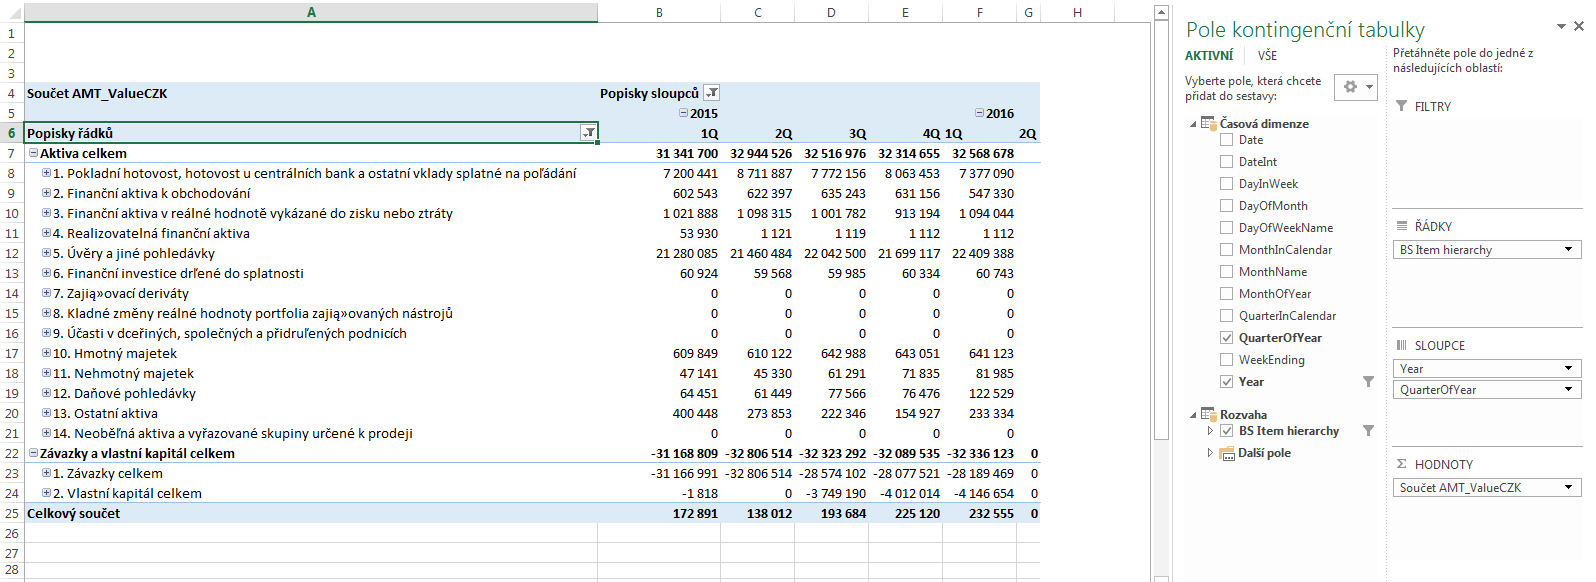
Power Pivot can be used to create relation model connected to other Excel sheets and to create data hierarchies where the data can be simply displayed and updated using pivot table.
")
Biggest upsides of Power Pivot:
- Creation of functioning relation model which was previously possible only in paid tools
- It is possible to combine it with Power Query and create automatic system for loading and reporting of data
- Possibility to report through contingent tables
- it is possible to work with the data via DAX formulas
Power BI – All Advantages In One Tool
I wrote on Power BI in several articles, e.g.:
- 10 reasons why use Power BI – I recommend to start here
- Starting with Power BI
- Power Query – Powerful Tool For Self Service BI – Introduction
- Getting started with Power Pivot
Whatever you can do using Power Query and Power Pivot in Excel can also be achieved in Power BI. It has all the tools integrated in itself plus it serves as a cloud based service. By creating Microsoft power BI account you open for yourself the doors to unseen possibilities.